Custom Spread Charts
Spread charts are a powerful tool for tracking custom comparisons, for example the difference between Microsoft and Google stocks. You can build any spread chart on TradingView by typing in a custom formula using (+-*/), i.e. “MSFT + GOOG” Learn more about Spread Charts on TradingView!
50+ Intelligent Drawing Tools
Drawing tools help you understand what stock prices are doing, and track how your predictions turn out. You can write on your chart or do freehand drawings, drag simple trend lines from A to B, apply the widespread Fibonacci and Gann tools, or apply the popular Elliot Waves. Learn more about Drawing Tools on TradingView!
Customized Technical Analysis
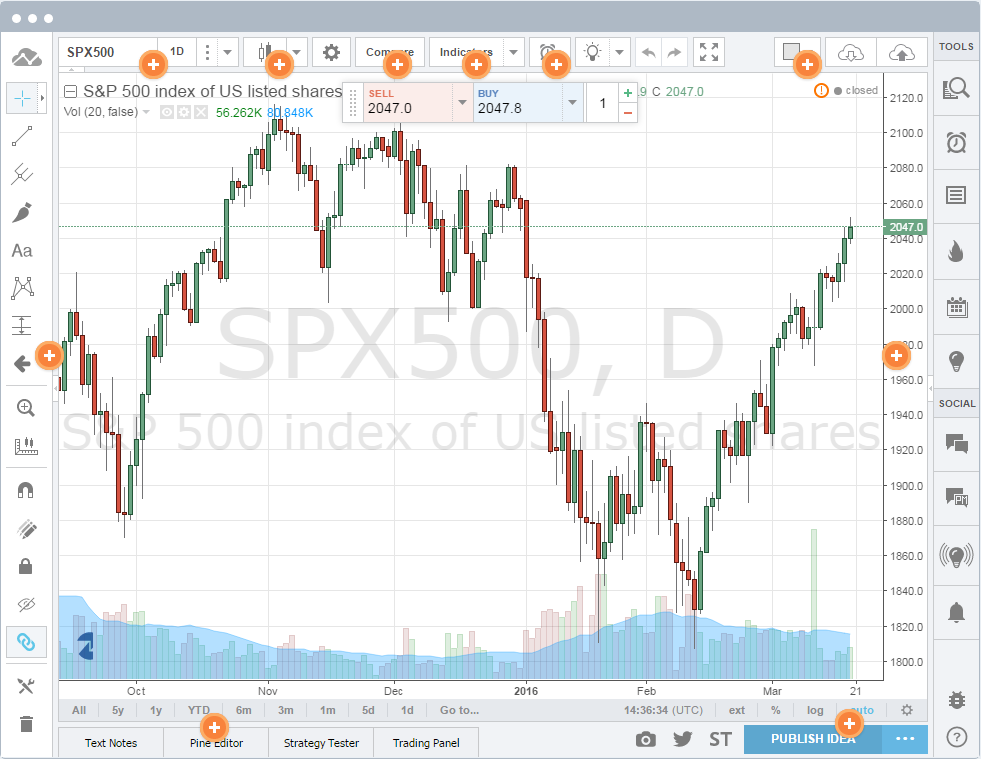
TradingView comes with a massive library of over 100 prebuilt technical indicators including Volume Profile!
But we realized that even this isn’t enough for all our users and we built the Pine programming language. Pine script allows you to create and share your own custom studies and signals. TradingView comes with over a hundred pre-built studies for an in-depth market analysis, covering the most popular trading concepts and indicators. A key advantage of Pine script is that any study’s code can easily be modified. Nearly any custom indicator can also be created from scratch.
Fundamentals Data
We have a unique toolset of institutional quality fundamental data on US companies. Viewing company financials in the context of history and market coverage lets you put current financials in perspective, especially when compared to peers and the company’s own performance over time.
Compare Symbols
Comparing a stock to the benchmark S&P 500 index is a great way to gauge its performance – to see if it’s doing better or worse than the industry. TradingView lets you compare any stock to any index or any other stock based on % change since the starting point. Learn how to compare symbols on TradingView.
Advanced Price Scaling
When you are ready to get technical, our charts let you set the price scales to match your type of analysis. There are linear, percent and log axes for drastic price movements. You can use two separate price scales at the same time: one for indicators and one for price movements. Read more about scaling options.
Right-click on the price scale to see possible options: change scaling type, enable auto-scaling or show another price scale. Right-clicking on indicators lets you choose which scale to use, so several data series with different scaling can co-exist in one chart. You can also drag price and time scales to increase or decrease compression.
Multiple Symbols on the Chart
It’s often useful to search for relationships between different stocks – do they move in tandem or always in opposite directions? With TradingView you can look at different stocks on the same chart, even if one trades at $100 and another is a penny stock. Learn how to add multiple symbols on the single chart on TradingView.
Study Templates
Studies can be assembled into sets to create study templates. Once a template is created, an entire set of studies can be applied to any chart, at any time, with just one click. It is possible to switch between different templates. Learn how to use Study Templates on TradingView.
Extended Trading Hours and Time Zone Options
TradingView allows you to know what’s happening outside of regular trading hours, and lets you stay more informed about the market! You can display data series using either local or exchange timestamps. Right-click on the time scale to change these options. Learn more about Extended Trading Hours on TradingView.
Hot Lists
Pre-built hot lists continuously scan the US stock market to identify best trading opportunities. Hotlists dynamically show different symbols based on the criteria selected, not to be confused with watchlists that always show only the symbols you need to monitor.
Synchronized Watchlists
Keep watch on your favorite stocks in a convenient scanner list. You can add symbols, sort the list and save custom lists under unique names. With TradingView, your watchlists are with you wherever you go, and you can stay on top of the markets on any device that you use TradingView on.
Relevant Real-Time News & Headlines
You see only relevant news next to the stock you are currently looking at (i.e. if you are looking at Facebook chart, only Facebook news will appear). We filter headlines from leading news agencies.
Real-time Conversation
Conversation is a real-time chat, so you can talk to other people looking at the same symbol. In the chat you send links to your charts, and talk about them with people analyzing the same ticker. Conversations let you discuss current market conditions here and now, while publishing charts is your vision of the future.
Publish Chart
Being able to publish and share your ideas is one of the key features of TradingView. Publishing will share your trading idea with the financial web and the investing community so that others can comment and rate it. Learn more about Publishing on TradingView.