
TigerTrade Trading Platform Key Features
TigerTrade is an innovative software package that combines all the tools that a successful trader needs. A flexible customizable workspace, intuitive interactive visualization of market data, and extensive filtering components are just a small part of what you can get.
Sign Up Today
What TigerTrade can help you do:
- Understand volumetric analysis and use it in your trading
- Improve your professional awareness of market processes
Tiger.Trade Key Features
Charts
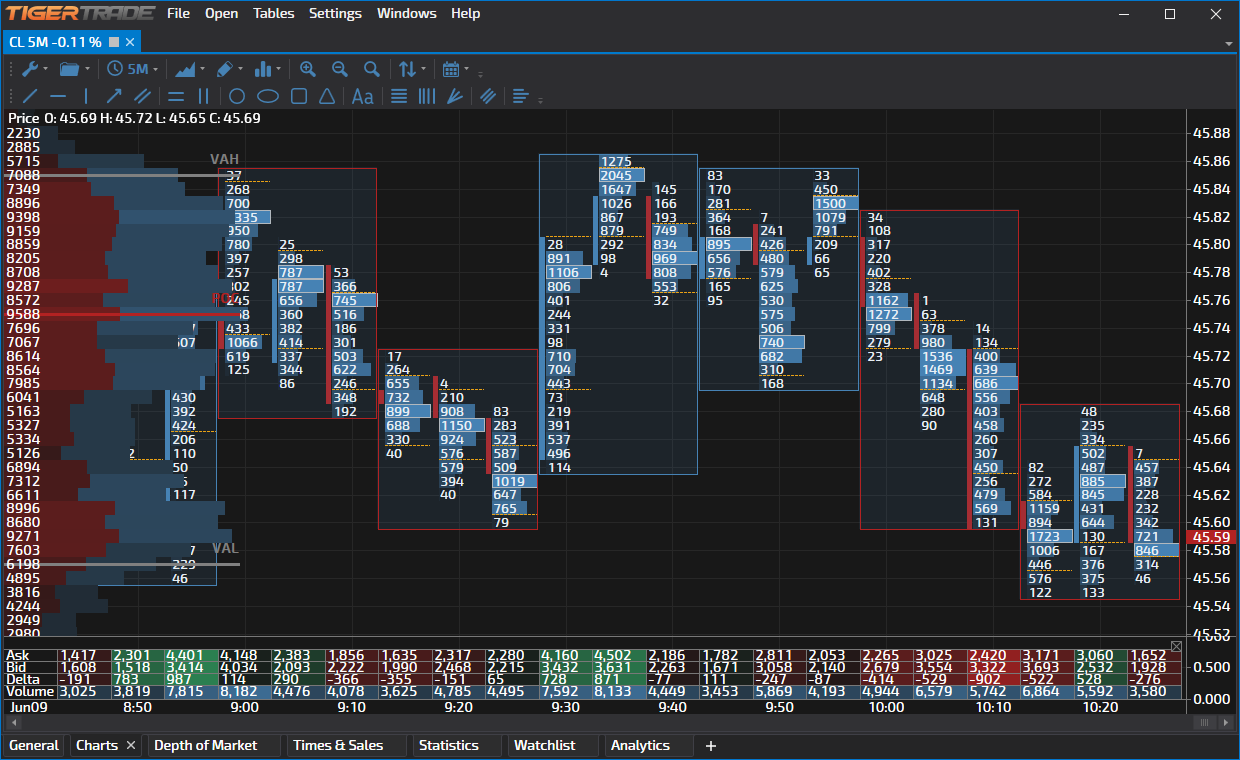
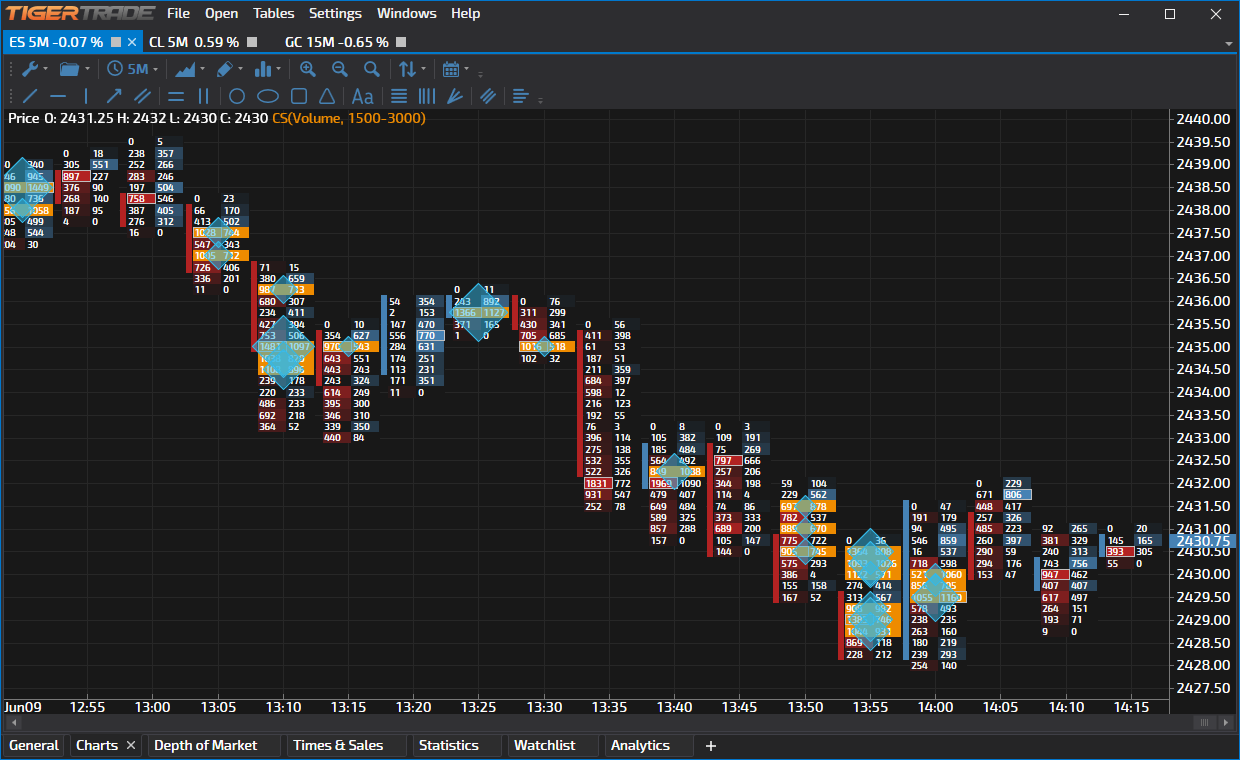
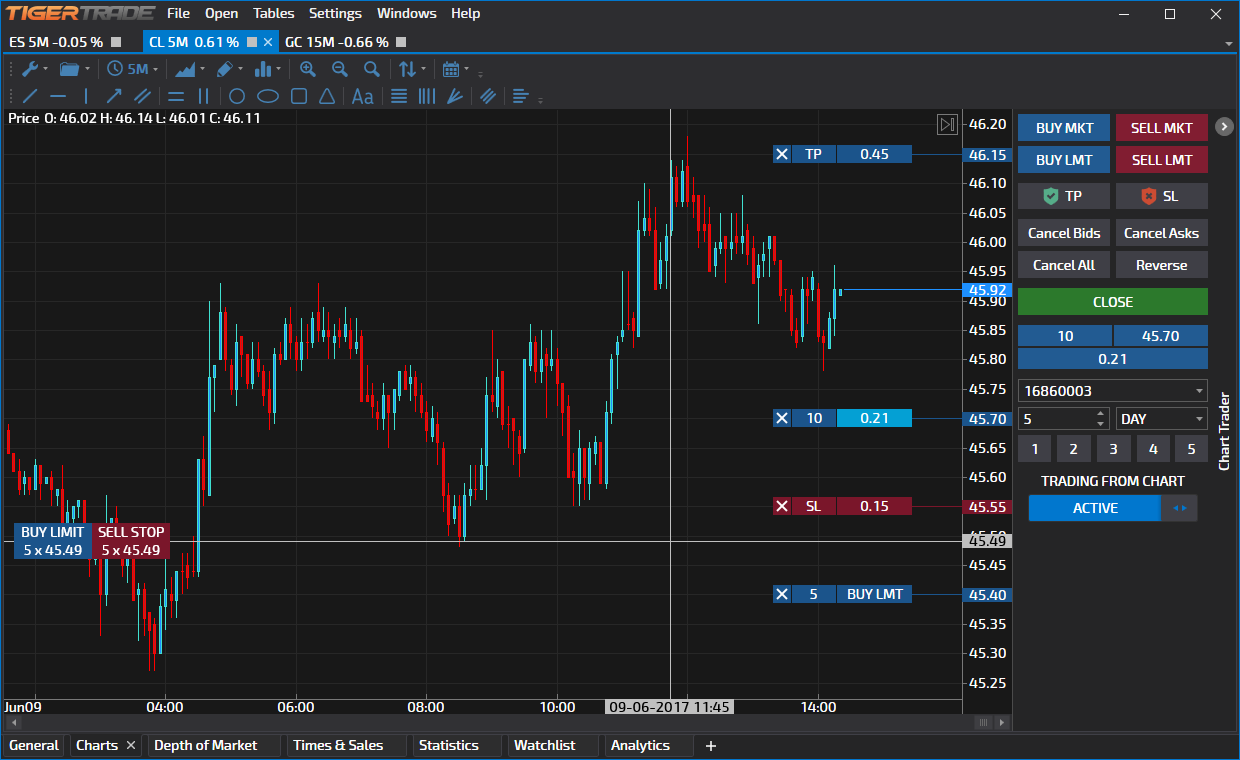
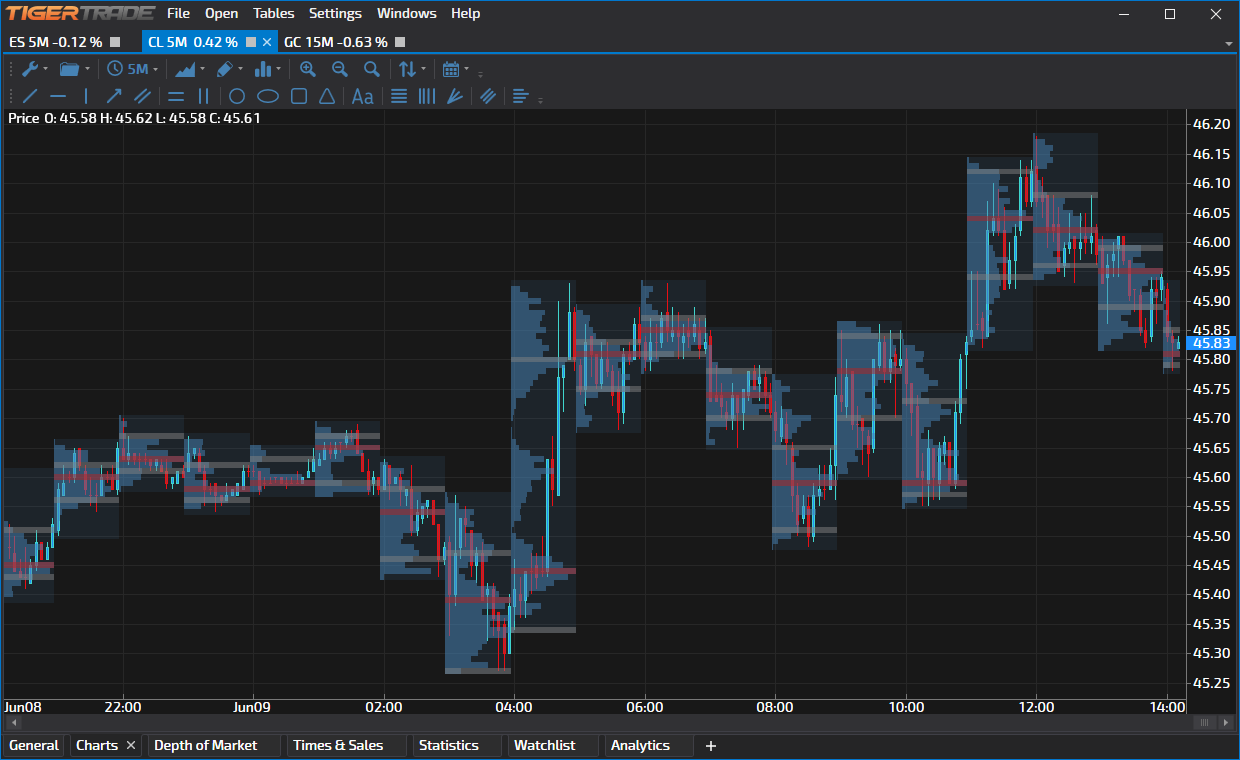
Charts are one of the main sources of information when trading. Our platform supports several types of charts, but the main ones are the classic candlestick and the cluster chart. Due to an extensive list of indicators and graphical objects, the chart window has endless possibilities for performing high-quality technical analysis. In addition to the standard set of popular indicators, the platform has a number of unique indicators that allow you to assess the current market situation as accurately as possible.
Depth of Market
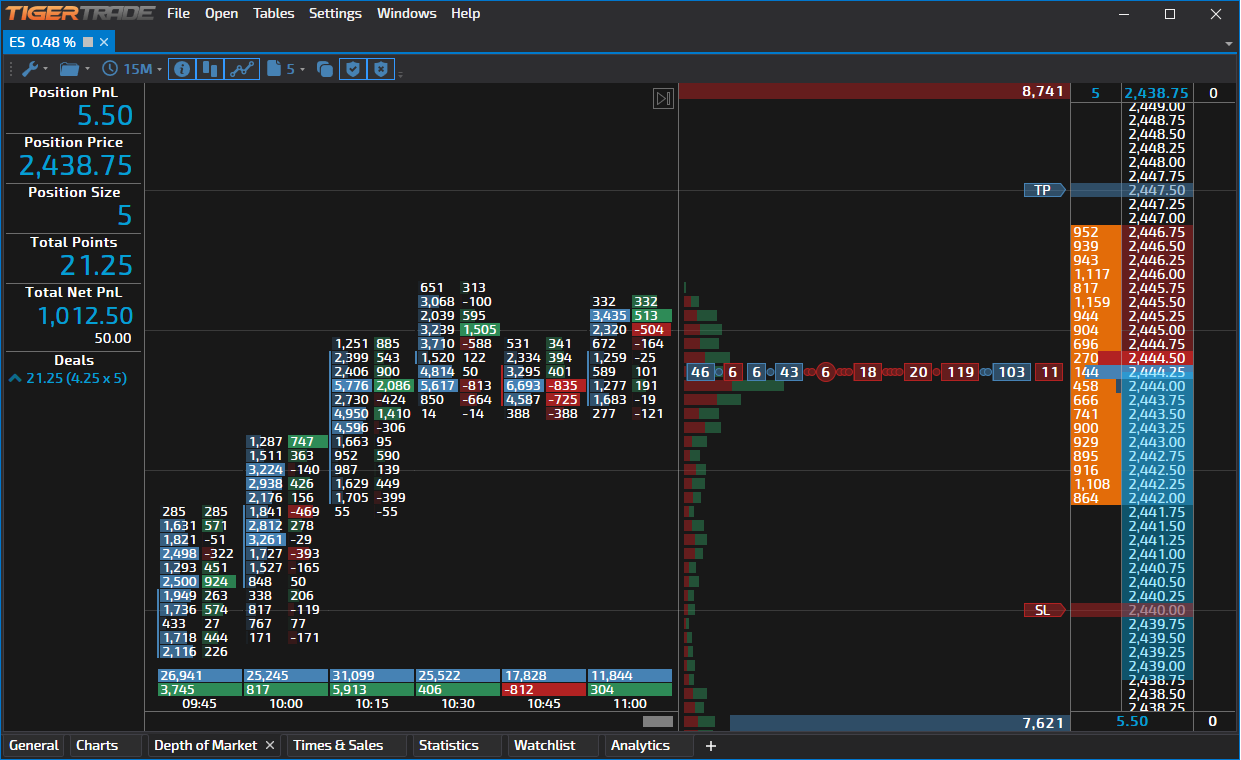
TigerTrade uses dynamic depth of market. In contrast to the classic DOM, this lets you clearly track the dynamics of price changes. In the DOM window, you can also see three additional sections. The first section displays information about the open position, your financial results for the day, and a list of your recent transactions. Next, you can see a section with a fully customizable cluster chart. The last section shows a trade feed with bubbles, which can optionally also show the unique balance indicator and the overall volume histogram for the current day.
Times & Sales
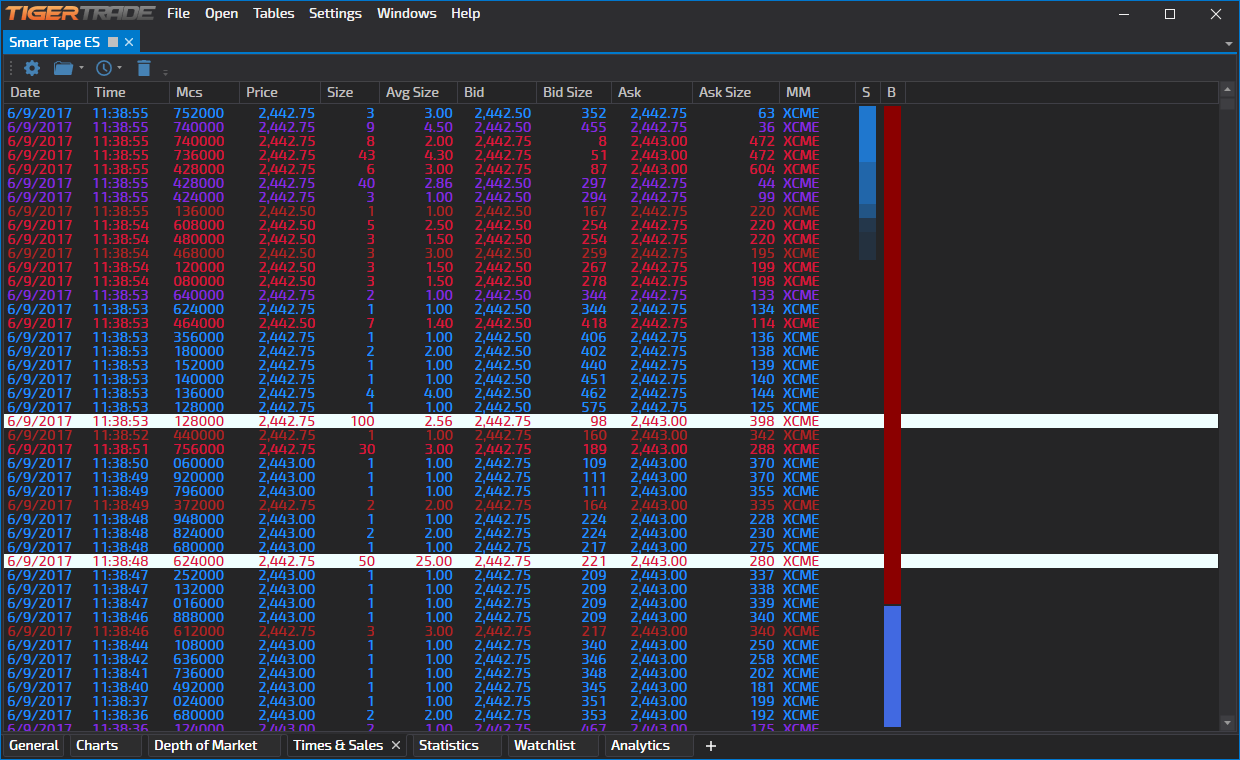
The trade feed shows the stream of market orders that have been completed in the symbol at the current time. It displays a table with information about the time, price, size, bid, ask and direction of each trade. It’s worth noting the set of additional features that every trader needs: the system of special alerts that lets you set a specific color or sound for each row with a volume that goes higher than you specify, and the features for aggregating and filtering trades that are designed to structure incoming data and eliminate extra noise.
Statistics
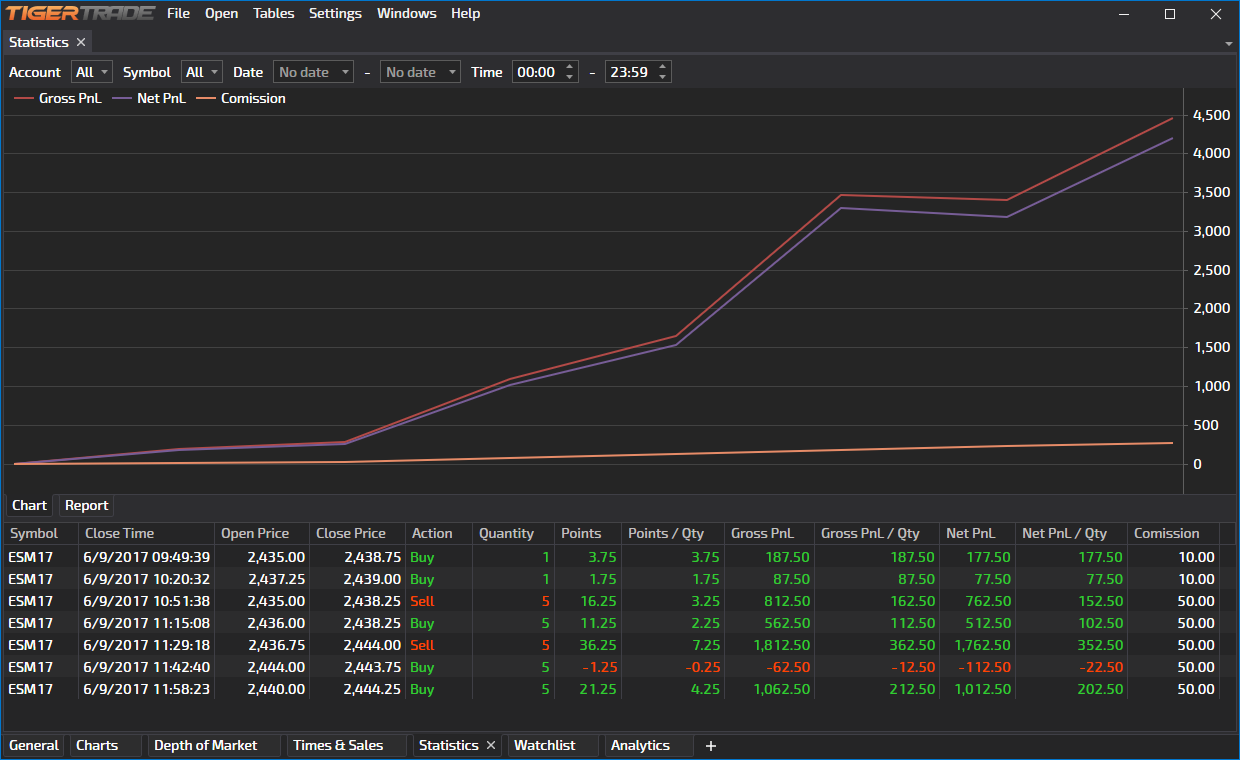
At the bottom of the window, you can see a list of completed trades. Comprehensive information for each transaction includes the opening and closing time, the direction, the volume, the financial result, and the commission fee. The upper part of the window shows three charts: yield in points and rubles, and the fee chart. You can filter the list of trades by account, symbol, or date and time of the transaction. The data is updated in real time so you can see how successful your trading is.
Watchlist
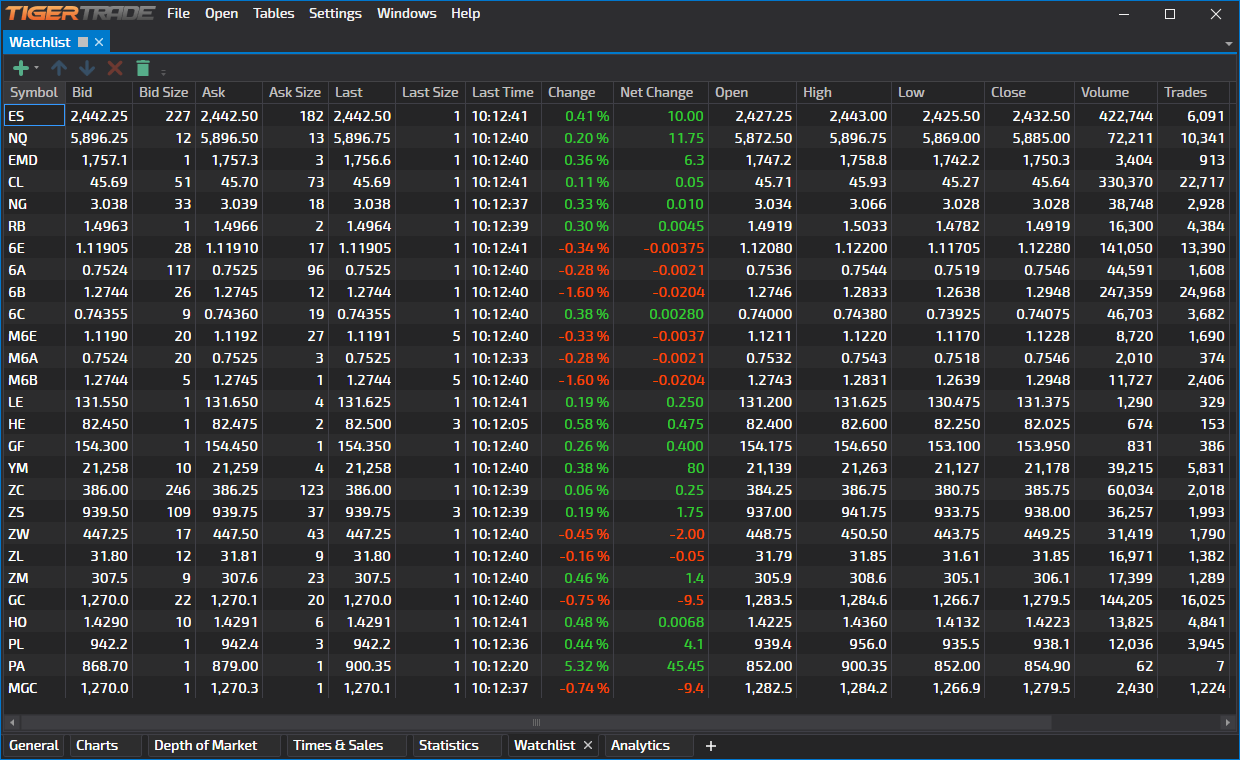
In the watchlist window, you can track live parameters from trading symbols. The most useful ones are the percentage change in price since opening, the price of the last transaction, and open interest. Use our linking feature to change the symbol simultaneously in all windows that have been combined in a group, with just one click on the desired symbol in the table.
Analytics
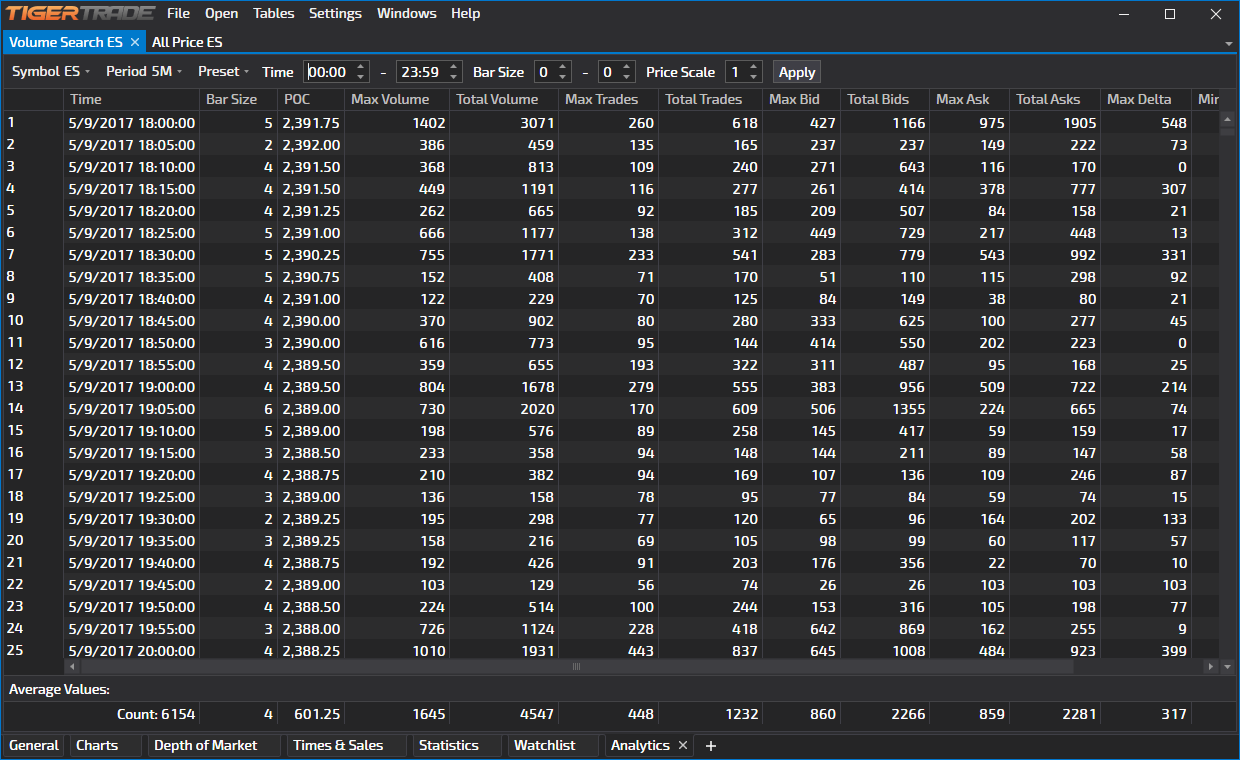
The platform includes two analytics modules: All Price and Volume Search. The table of all prices generates information about the traded volume at each price during a certain time interval, which plays an important role in determining the key levels for the upcoming trading session. The second module allows you to assess the state of the market at a deeper level, so you can search for the values of a large volume and then identify its location on the chart.
Most Recent Blog Posts
US Martin Luther King Day Holiday Trading Schedule (2025)
Jan 17, 2025by AMP Futures
US National Day of Mourning for Former President Jimmy Carter
Jan 7, 2025by AMP Futures

